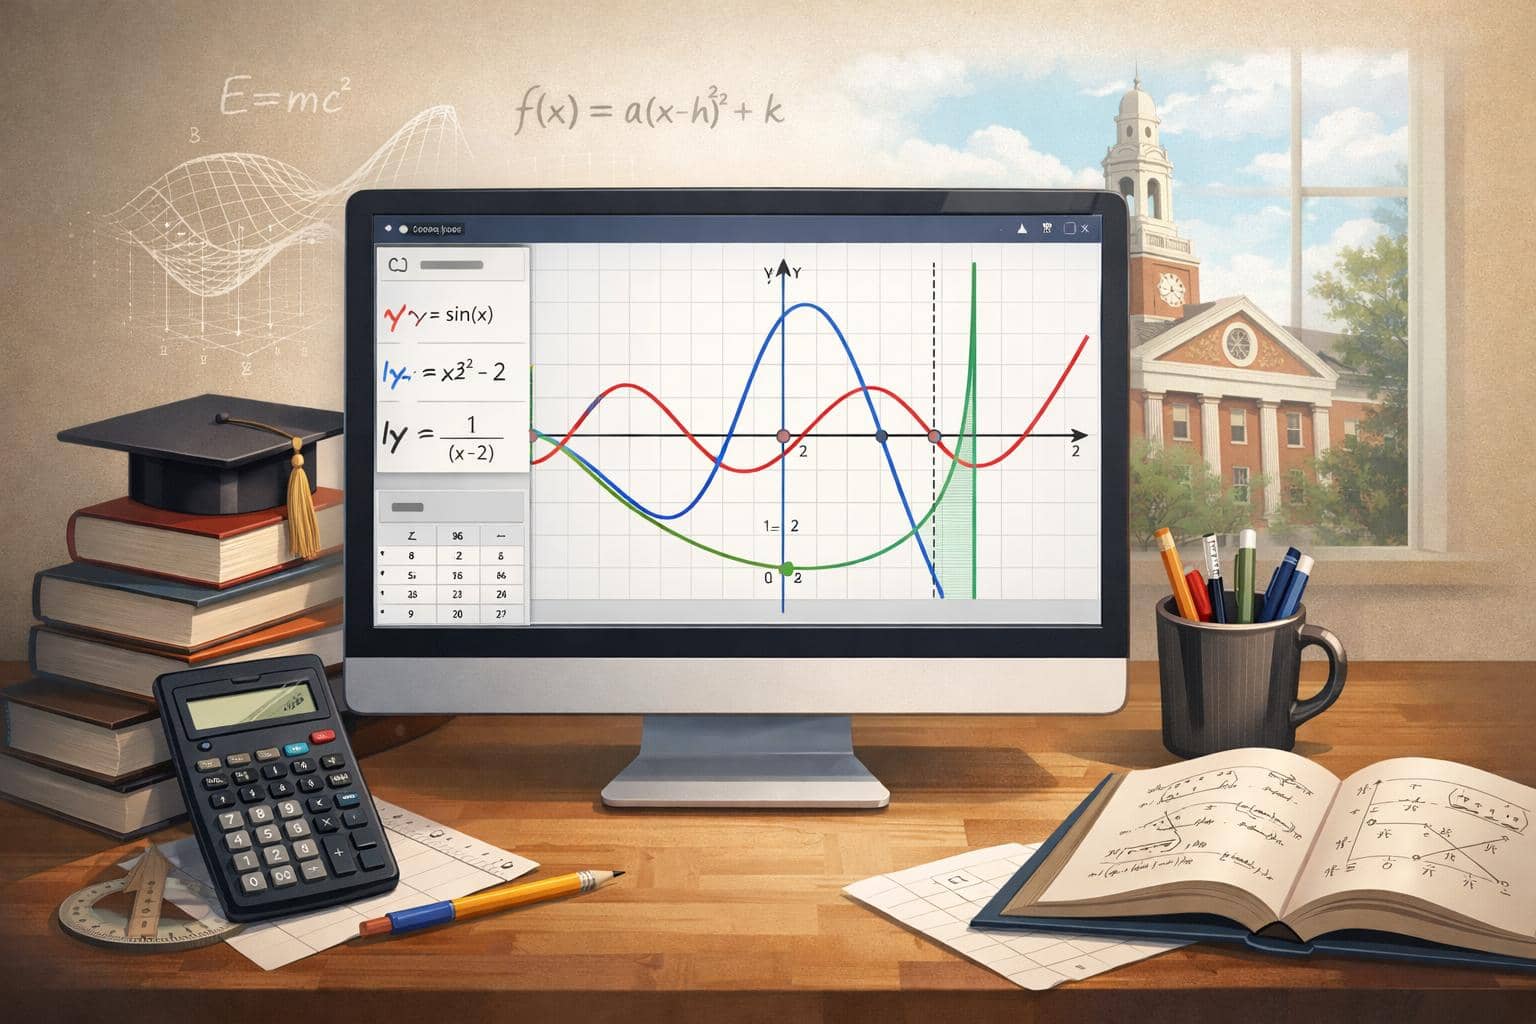
The Harvard Graphing Calculator is a powerful online mathematics tool designed to help students and educators visualize equations, analyze functions, and explore graphs with precision. It provides accurate plotting, intersection detection, and value evaluation in a fast and interactive environment.
This graphing calculator allows you to plot multiple equations, evaluate values at specific coordinates, detect roots, and analyze intersections in real time. Built with mathematical accuracy and academic use in mind, it supports algebra, trigonometry, and calculus-level expressions.
What Is a Harvard Graphing Calculator?
A Harvard Graphing Calculator is an advanced online function plotting tool that graphs mathematical equations on a coordinate plane and allows users to analyze their behavior visually.
Although it is not affiliated with Harvard University, the term reflects an academic-level graphing experience. Graphing calculators have been widely used in modern education since the 1990s, particularly in secondary and university-level mathematics.
According to the National Council of Teachers of Mathematics (NCTM), technology-assisted graphing improves conceptual understanding when students can connect algebraic equations to visual representations. Research in mathematics education consistently shows that visualization strengthens comprehension of abstract concepts.
Unlike a scientific calculator that evaluates a single expression, a graphing calculator plots continuous functions across a range of x-values. This enables students to see patterns such as symmetry, slope changes, turning points, and asymptotic behavior.
How Graphing Technology Improves Mathematical Understanding
Visual learning plays a critical role in mathematics education. A 2014 study published in the Journal for Research in Mathematics Education found that students who used dynamic graphing tools showed improved conceptual reasoning compared to those who relied solely on symbolic manipulation.
Similarly, a 2019 study at Stanford University reported that interactive visualization tools increased retention of algebraic concepts by reinforcing multiple cognitive pathways.
These findings align with modern pedagogical approaches that emphasize exploratory learning. When students adjust coefficients in an equation like:
y = ax² + bx + c
they can immediately observe how the graph shifts, stretches, or reflects. This reinforces the relationship between symbolic math and geometric interpretation.
Core Features of This Harvard Graphing Calculator
This Calculator includes essential academic-grade capabilities:
- Plot multiple visible functions simultaneously
- Find x-intercepts within the current view
- Detect intersections between function pairs
- Evaluate function values at specific x-coordinates
- Generate dynamic value tables
- Toggle between Degree (°) and Radian (rad) mode
- Handle undefined values safely
- Zoom and pan across the coordinate plane
The coordinate plane supports ranges such as:
xMin: −10 to xMax: 10
yMin: −10 to yMax: 10
Users can modify ranges for broader analysis, such as −100 to 100 units.
The calculator respects proper order of operations ( PEMDAS — Parentheses, Exponents, Multiplication, Division, Addition, Subtraction ) and parses nested expressions securely.
Supported Mathematical Functions and Expressions
This graphing calculator supports a wide range of mathematical operations:
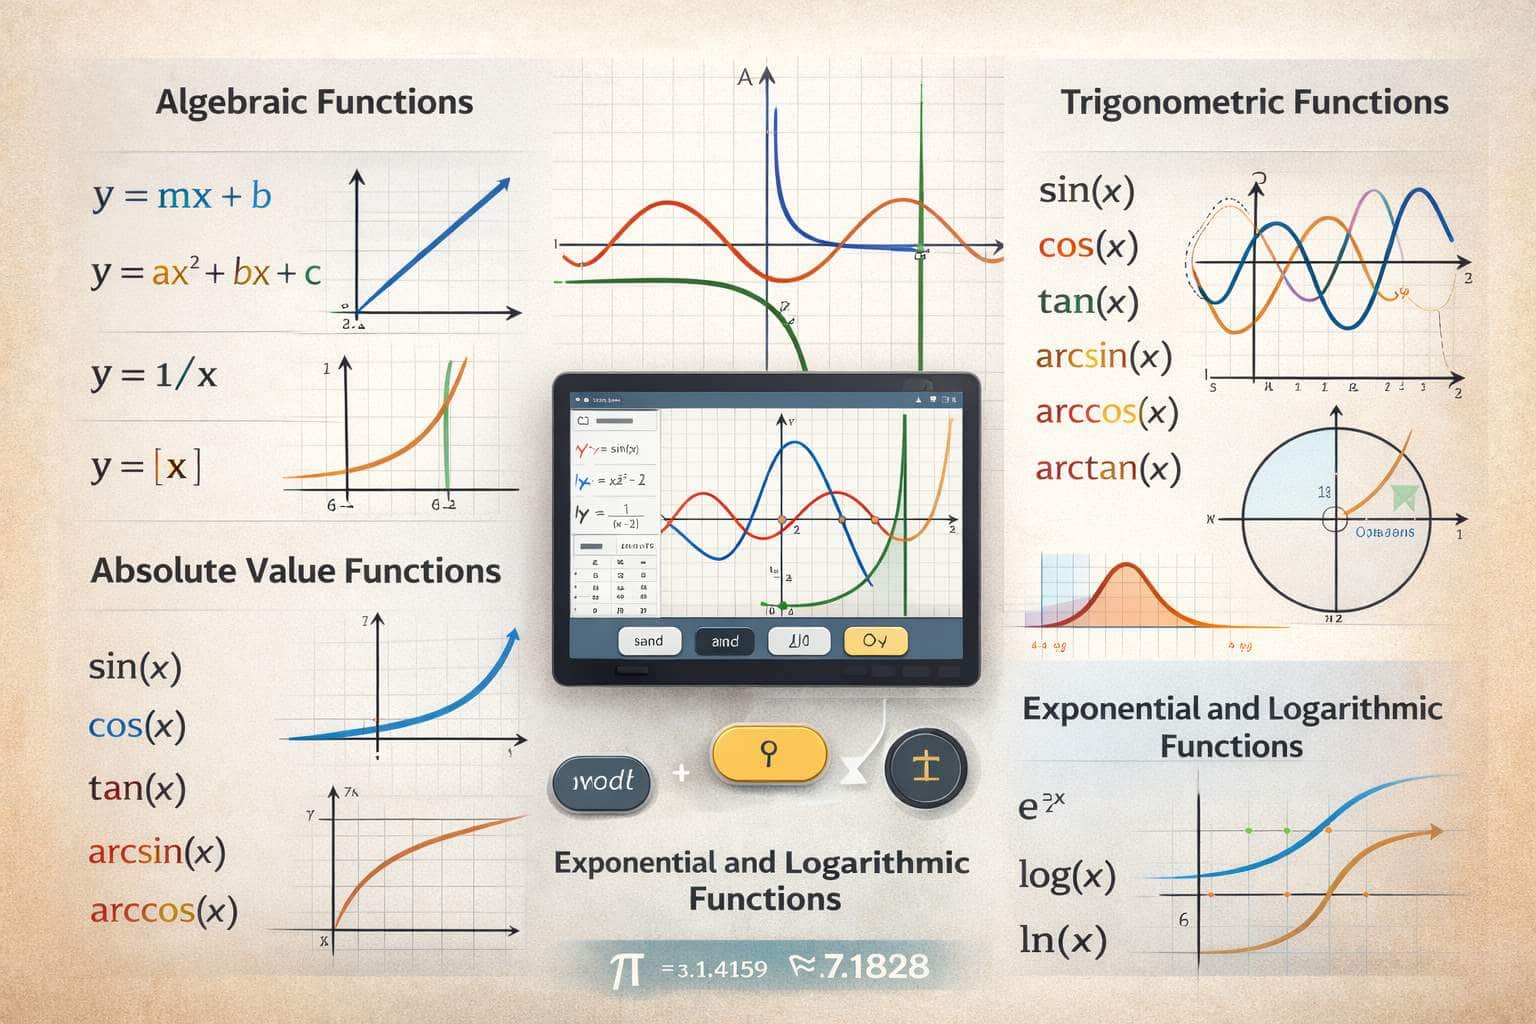
Algebraic Functions
- Linear equations ( y = mx + b )
- Quadratic functions ( y = ax² + bx + c )
- Cubic and higher-degree polynomials
- Rational expressions ( y = 1/x )
- Absolute value functions ( y = |x| )
Trigonometric Functions
- sin(x)
- cos(x)
- tan(x)
- arcsin(x), arccos(x), arctan(x)
The calculator allows switching between Radian ( rad ) and Degree ( ° ) modes to align with course requirements.
Exponential and Logarithmic Functions
- e^x
- log(x)
- ln(x)
It supports mathematical constants such as π (pi ≈ 3.14159) and e (Euler’s number ≈ 2.71828).
Intersections and Root Finding Explained
One of the most powerful capabilities of the Harvard Graphing Calculator is solving equations visually and numerically.
X-Intercepts
An x-intercept occurs where a function crosses the x-axis, meaning f(x) = 0.
For example:
y = x³ − 4x
The calculator correctly identifies:
x = −2
x = 0
x = 2
The system scans across the visible x-range and refines solutions numerically using root approximation techniques.
Intersections
When multiple functions are visible, the calculator solves:
f(x) = g(x)
For example:
y = x²
y = 2x + 3
The intersections occur at:
(−1, 1)
(3, 9)
Only real solutions within the visible coordinate window are returned.
Handling Discontinuities and Undefined Values
Proper mathematical tools must handle undefined points safely.
For example:
y = 1/x
At x = 0, division by zero occurs. The calculator correctly displays:
undefined
and visually separates the graph to prevent false vertical connections.
In calculus terms, this represents a vertical asymptote.
According to a 2018 mathematics curriculum review by the University of Cambridge Faculty of Mathematics, properly visualizing asymptotic behavior improves student comprehension of limits and continuity concepts.
The calculator also handles removable discontinuities, such as:
y = (x² − 4)/(x − 2)
At x = 2, the value is undefined even though the function simplifies algebraically. The tool respects this mathematical restriction.
Evaluate at X and Value Tables
The Evaluate at X feature allows precise substitution.
Evaluate at X means substituting a chosen x-value into the function to compute its exact output.
Example:
y = 1/x
x = 2
Result:
0.5
If x = 0:
Result:
undefined
The value table generates structured data across selected intervals, such as:
From −5 to 5
Step size: 1
This produces ordered pairs useful for homework, modeling, and classroom instruction.
Educational and Academic Applications
This Harvard Graphing Calculator is suitable for:
- High school algebra
- Pre-calculus
- Trigonometry
- Calculus I and II
- College mathematics
Teachers can demonstrate transformations in real time. Students can verify symbolic solutions visually.
The National Science Foundation (NSF) has emphasized the importance of digital tools in STEM education ( Science, Technology, Engineering, Mathematics ), noting that interactive technologies enhance engagement and understanding in quantitative disciplines.
Why Our Calculator Stands Out
Unlike basic online plotters, this calculator:
- Supports multi-function comparisons
- Accurately detects intersections
- Prevents invalid plotting
- Uses secure mathematical parsing
- Requires no login or installation
It functions as a complete mathematical visualization environment while maintaining performance and usability.
Example Table Output and Context
Below is an example of what a generated value table represents. The table displays x-values and corresponding y-values calculated from the function y = x² over the interval −5 to 5 with a step size of 1 unit.
| X | Y |
|---|---|
| −5 | 25 |
| −4 | 16 |
| −3 | 9 |
| −2 | 4 |
| −1 | 1 |
| 0 | 0 |
| 1 | 1 |
| 2 | 4 |
This table shows how the quadratic function produces symmetric outputs around zero.
Frequently Asked Questions (FAQ)
Yes. You can plot several visible functions simultaneously.
Yes. It supports sine, cosine, tangent, and inverse trig functions in both Degree ( ° ) and Radian ( rad ) modes.
It solves f(x) = g(x) numerically for visible functions within the current graph window.
Yes. It detects x-intercepts by solving f(x) = 0 within the visible range.
The calculator returns “undefined” and does not connect invalid graph segments.
Yes. It handles polynomials, rational functions, exponentials, logarithms, and trigonometric equations.
Yes. It uses a mathematical expression parser and numerical solving methods to ensure reliable computation.
Summary
This Calculator delivers accurate multi-function plotting, numerical root detection, intersection solving, and dynamic value generation in a single interactive environment. From algebraic equations to trigonometric analysis, it transforms symbolic mathematics into visual understanding.
Some of our other calculators: